• Welcome to BirdForum, the internet's largest birding community with thousands of members from all over the world. The forums are dedicated to wild birds, birding, binoculars and equipment and all that goes with it.

    Please register for an account to take part in the discussions in the forum, post your pictures in the gallery and more.
ZEISS DTI thermal imaging cameras. For more discoveries at night, and during the day.

Are transmission graphs relevant for you when selecting binoculars? How? (1 Viewer)

Any science or measurement that shows how a bino/telescope works compared to others is interesting and will attract my attention. Then comes the collimation of facts and figures and not least the testing (if possible).
I bought my habichts partly based on transmission data (but with maker and build added in) and was not disappointed!

Per
 
It’s somewhere between 0.88 and 0.90, the other numbers are fluff.
That's an interval of 88%-90%
89.3 +- 1 = consistently measured as being between 88.3 and 90.3
That's an interval of 88.3%-90.3%
Nothing you said changes what I said.

irregardless of how you think of the precision of measurements: rounding can lead to different results, so yes, my comment changes what you said.

Here is an example:

Suppose the true transmission is 89.5%, there can be a difference in the outcome whether or not you take the "fluff" numbers into account:

If you have 30 measurements with reading of 0.1% and deviation (precision) of 1% (random numbers 89.5 +-1% in excel), you can get the following:
90,0 89,8 89,9 90,1 89,5 89,6 89,6 90,1 90,4 89,9 90,5 89,6 90,0 89,9 89,8 89,2 88,8 89,3 89,0 89,3 88,9 89,0 89,4 88,6 88,8 89,3 89,0 89,5 88,6 88,9
You average 89,5% +-1%, but as the outcome is 89,47%, rounding would actually result in 89%.

take note that the average is designed into the numbers (random deviations of +-1% hoovering around 89.5%), so the larger the dataset, the closer it gets to the average, and in this example, it's pretty close.

If you have the exact same 30 measurements (same random numbers 89.5 +-1% in excel) and you think the decimals are fluff because you consider every decimal to have no relevant information, and thus you round those 30 measurements, you get:
90 90 90 90 90 90 90 90 90 90 91 90 90 90 90 89 89 89 89 89 89 89 89 89 89 89 89 90 89 89
You average 89.6%+-1%, or, if rounded to the closest digit, 90%+-1%

So if you
1. take the measurements with decimals for granted (as you trust the precision of the measurement), but round the average to the closest digit, you get 89%. That is 0.5% off the true value, by leaving out info (measurements with decimals) you trust.
2. don't take the decimals in the measurements for granted (you don't trust the precision), and round the measurements themselves to the closest digit, you get 89.6% (0.1% off the true value and the value you would have gotten when including decimals), but as you are keen on rounding the decimals out, your end result is 90%. That's also 0.5% off the true value, and 1% off the first approach.

Note that you will probably get closer to the true value if you're rounding, but only if you do a lot more measurements than if you would just include the decimals, or omit the rounding of averages.

If those results are important or relevant, is up to you, or maybe to a marketeer that would love to write '90% transmission' or 'highest transmission in its class'...
 
That's an interval of 88%-90%

That's an interval of 88.3%-90.3%


irregardless of how you think of the precision of measurements: rounding can lead to different results, so yes, my comment changes what you said.

Here is an example:

Suppose the true transmission is 89.5%, there can be a difference in the outcome whether or not you take the "fluff" numbers into account:

If you have 30 measurements with reading of 0.1% and deviation (precision) of 1% (random numbers 89.5 +-1% in excel), you can get the following:
90,0 89,8 89,9 90,1 89,5 89,6 89,6 90,1 90,4 89,9 90,5 89,6 90,0 89,9 89,8 89,2 88,8 89,3 89,0 89,3 88,9 89,0 89,4 88,6 88,8 89,3 89,0 89,5 88,6 88,9
You average 89,5% +-1%, but as the outcome is 89,47%, rounding would actually result in 89%.

take note that the average is designed into the numbers (random deviations of +-1% hoovering around 89.5%), so the larger the dataset, the closer it gets to the average, and in this example, it's pretty close.

If you have the exact same 30 measurements (same random numbers 89.5 +-1% in excel) and you think the decimals are fluff because you consider every decimal to have no relevant information, and thus you round those 30 measurements, you get:
90 90 90 90 90 90 90 90 90 90 91 90 90 90 90 89 89 89 89 89 89 89 89 89 89 89 89 90 89 89
You average 89.6%+-1%, or, if rounded to the closest digit, 90%+-1%

So if you
1. take the measurements with decimals for granted (as you trust the precision of the measurement), but round the average to the closest digit, you get 89%. That is 0.5% off the true value, by leaving out info (measurements with decimals) you trust.
2. don't take the decimals in the measurements for granted (you don't trust the precision), and round the measurements themselves to the closest digit, you get 89.6% (0.1% off the true value and the value you would have gotten when including decimals), but as you are keen on rounding the decimals out, your end result is 90%. That's also 0.5% off the true value, and 1% off the first approach.

Note that you will probably get closer to the true value if you're rounding, but only if you do a lot more measurements than if you would just include the decimals, or omit the rounding of averages.

If those results are important or relevant, is up to you, or maybe to a marketeer that would love to write '90% transmission' or 'highest transmission in its class'...
LOVELY! 😃
 
See line one below.

There are rules for significant digits, which many seem to ignore.

Do a blind test, at any visible wavelength of your choice, and report back on whether you can tell the difference between 90.0% and 90.3%. I’ll wait right here.

PS: Everything you say is true, it just doesn’t have much relevance to deciding which binocular to buy.
 
Last edited:
See line one below.

There are rules for significant digits, which many seem to ignore.

Do a blind test, at any visible wavelength of your choice, and report back on whether you can tell the difference between 90.0% and 90.3%. I’ll wait right here.
You'll need accomodation and take-away...
 
See line one below.

There are rules for significant digits, which many seem to ignore.

Do a blind test, at any visible wavelength of your choice, and report back on whether you can tell the difference between 90.0% and 90.3%. I’ll wait right here.

PS: Everything you say is true, it just doesn’t have much relevance to deciding which binocular to buy.
I won't do the test, but whether or not someone can tell the difference with their vision (or any of their senses) is imho to be separated from:
1. measurements and their precision.
2. data processing ( or data manipulation = e.g. rounding, filtering out noisy / faulty data / extracting statistics / ...)

0.893 +/- 0.00893 = +/- .009

Lots of numbers there, but I’m wondering how many are significant. It’s somewhere between 0.88 and 0.90, the other numbers are fluff.

People see all those numbers and think “Wow! Those guys are really doing a bang-up job there.”
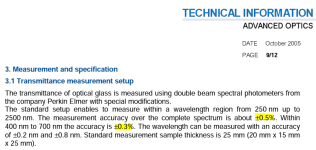
When using decent equipment like in this technical document about Schott glass (p. 9):
1691183716498.png
it seems like decimals are likely significant.

Please note that (unfortunately), the document mentions accuracy where they actually are talking about precision. Accuracy = the measurement is a good approach of the true value. (High) precision = you measure the same (or very close to the same) value over and over again. The spectrophotometers they use are within 0.3% plus or minus for the same glass sample. So e.g. 89.3% can actually have some value, but only if Allbino measures it with good equipment. I guess their equipment is not as state of the art as that from Schott or Gijs, but I also reckon they use decent equipment out of a (university) lab or alike.
I would be happy to hear what you can share with regards to the rules for significant digits you mention. As far as I know, all non-zero digits are significant.
 
“If a number expressing the result of a measurement (e.g., length, pressure, volume, or mass) has more digits than the number of digits allowed by the measurement resolution, then only as many digits as allowed by the measurement resolution are reliable, and so only these can be significant figures.”

It‘s a personality quirk of mine. I think it is absurd to use so many numbers, and imply such accuracy, when overall it doesn‘t make a fig‘s worth of difference in the context of the original question posed by this thread.

It borders on the pretentious. (just my opinion)
 
Last edited:
Schott is using an industry standard measuring instrument, I used to use one, the accuracy seems about right. That’s the uncertainty in a measurement, not the precision as you can average to reduce noise. If you are measuring low transmissions (eg off band filters) then the accuracy % would likely scale much smaller, but you’d need to check with calibrated filters.
Interesting to note that schott measure a 25mm thick sample as glass is rather transmissive and so you need a good thickness to get much measurable absorption.
Averaging can help improve accuracy, but not if the thing you are measuring is varying (different bino samples), in which case rather than using the standard error (which gets smaller with increasing measurements) you need to use the Welch–Satterthwaite equation to estimate the likely uncertainty. This of course does not include any systematic uncertainty contribution from your instrument (eg the 0.3% schott mention). More accuracy then needs a “better ruler”.

Peter
 
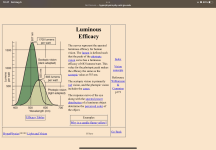
I read somewhere that the eye perceives light around 550 nm (Green) ten times more than the red and blue colors at the extremes of the visibile spectrum (~450nm and 750nm). So an optic transmitting 90% of green light will be much brighter to our eyes than one transmitting 90% of blue and green. i.e., don't panic if the transmission curve drops off in red and blue, it's not as important as it might seem.
If so, this is the situation for day light vision.

How about twilight vision? Maybe the transmission of blue light is suddenly very important?
 
Not really.
The graph does not show how the scotopic (night) vision depends on the variation in transmission of blue light.

If the transmission of blue light pass from 90% to 80%, how the vision is affected? It will be lower by 10%, by 20%?
What are consequences of this 10% change? By example, less contrast? Or maybe less resolution?
If consequences are significant, the 10% variation is significant, therefore this knowledge helps to select a binocular.
 
89.3 +- 1 = consistently measured as being between 88.3 and 90.3

Also keep in mind that the quoted transmissions of binoculars is usually the maximum transmission, be it in the 400-500nm, 500-600nm or 600-700nm range.

With regards to the question what's useful about transmission graphs: there are very useful if you can read them.

Just an example.

1. Below is a graph in the visible spectrum (400-700nm), and the transmission (in %) reaches >90% in the 600-700nm range.

View attachment 1524314
View attachment 1524315
You see that the transmission curve is relatively flat, and that the reds are well transmitted. So all in all, just from the transmission graph, one would assume that this binocular offers a view with balanced colors, maybe a bit warm.

2. Next, is another binocular.
View attachment 1524317
View attachment 1524316
The transmission curves decreases more sharply in the blue, but especially in the red. The maximum transmission is a bit higher though, around 92-93% in the middle of the visible spectrum. One would assume that this binocular offers a very bright view even in darker circumstances (in twilight, the visible light is skewed towards shorter wavelengths), but the image could be a bit cold (less red) and thus more yellowish-green.

3. the third one:

View attachment 1524318

This binocular has a nice flat curve, with some decline in the far reds. So mostly color neutral, with good transmission across the curve. A very good all-rounder.

4. And a last one, to show the difference:
View attachment 1524321
This one has an overal lower transmission (never reaching 90%). The curve is not flat but declines in the green/yellow before a peak in the reds and a bigger drop-off in the reds, so the image will be more blue-ish (lacking a peak in the green and yellow)

Thanks for watching.
Stars of this show, in no particular order:

a) Swarovski NL Pure 10x42 W B
b) Olympus 10x42 PRO
c) Leica Ultravid 10x42 HD
d) Carl Zeiss Victory HT 10x42

So can you say which binocular is which graph...? I bet you can! And that's why those graphs are worth looking at. They provide a wealth of info, especially for those that are only able to test binoculars in a shop, in circumstances that do not always enable you to truly test low light capabilities, colors,...
The first one is a Leica, the second one Zeiss, the third one a Swaro, then the last one has to be the Olympus.

Cheers,
Holger
 
For those (such as I) who have to look it up.

“In colorimetry, metamerism is a perceived matching of colors with different spectral power distributions. Colors that match this way are called metamers. A spectral power distribution describes the proportion of total light given off by a color sample at each visible wavelength; it defines the complete information about the light coming from the sample. However, the human eye contains only three color receptors, which means that all colors are reduced to three sensory quantities, called the tristimulus values. Metamerism occurs because each type of cone responds to the cumulative energy from a broad range of wavelengths, so that different combinations of light across all wavelengths can produce an equivalent receptor response and the same tristimulus values or color sensation. In color science, the set of sensory spectral sensitivity curves is numerically represented by color matching functions.Wikipedia
 
My son had some metameric trousers, changed from looking brown to dull green when changing illuminant from daylight to compact fluorescent. I have a sample that goes cream to pink under fluorescent. Depends on the combination of illuminant, eye response and the spectral reflectance profile of the object. The wiki article summarises nicely.

Peter
 
Main things that matter to me are not as easily found on spec sheets so much as in the hands and eyes. Still don't know why exactly I don't care for a few very popular binoculars, but ergonomics couple with ease of view, sharpness, clarity and color saturation go a long way towards gaining my interest. Maybe I'll try studying a little more, but then I'm not interested in owning perfection so much as having satisfactory functionality and may already be pretty well there. After another purchase or two...
 
For those who are interested, Indiana University conducted a research project aimed at isolating just which monochromatic wavelength is used by the himan eye when bringing an object to sharp focus. It turns out to be 572nm, which is somewhat close to the wavelength area representing the eye’s primary photopic response, but still somewhat removed enough for the difference to be significant when determing the dioptric value of ophthalmic lenses. The photopic peak response is said to lie between 555nm and 560nm (560nm is the ISO reference).
B
 
Interesting.

The green laser pointers are around 532 nm, supposedly, so they are a bit more “greenish” and 572 nm is more “yellowish”.
 

Users who are viewing this thread

Back
Top